Welcome to my GitHub Page
Here you can find some of the recent projects I have been working on. If you would like to know more about myself, please check my LinkedIn profile.
Machine Learning Projects
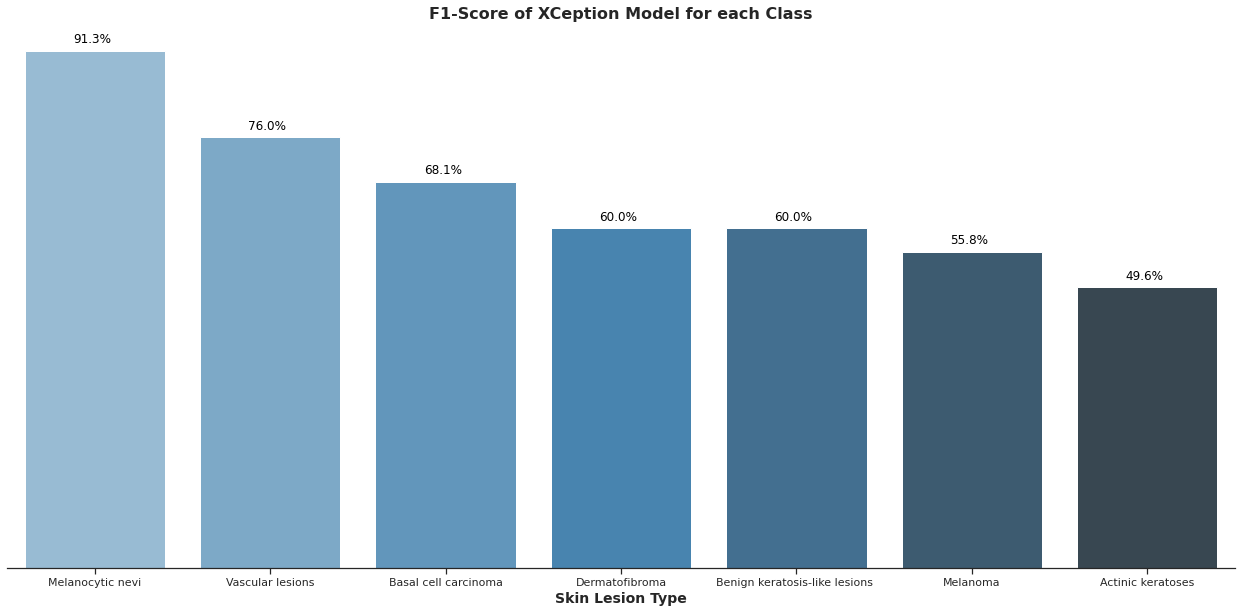
HAM10000: Skin Lesion Classification
- The HAM10000 dataset is composed of 10.015 dermatoscopic images of pigmented skin lesions. The dataset present seven classes of skin lesions, including Melanoma, a malignant type of cancer;
- Melanocytic nevi is the dominant class in the dataset (67%).
- Melanoma, seems to be more common in the ages of 45 to 70. Males represent 62% of the incidence of this type of lesionIt could result in a bias towards this type of os skin lesion;
- From the three different architectures shown in this study, XCeption achieved better accuracy in the test set (~80%);
- The dataset is unbalanced, for such cases the accuracy metric can give us a false perception of the model reliability. An analysis using F1-score and possible improvements are suggested
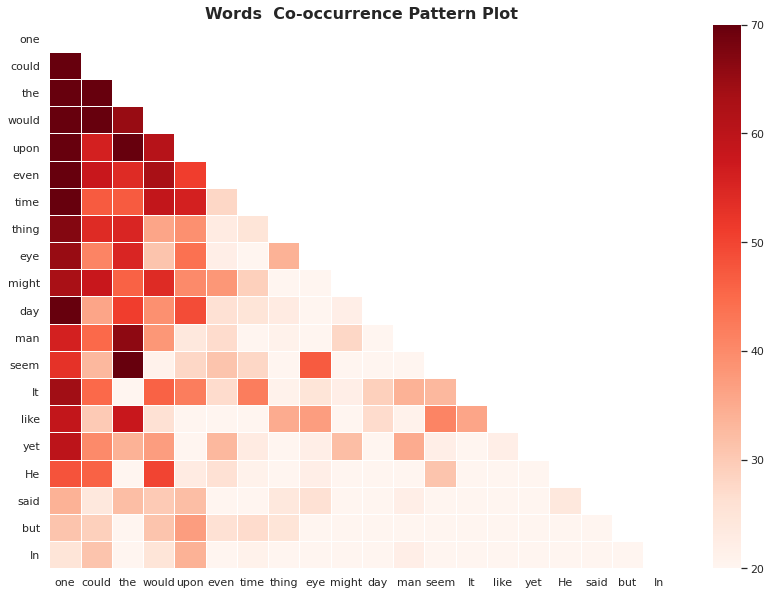
Kaggle Hallowen challenge
- The notebook is an analysis of the Kaggle Hallowen challenge from 2017. The goal is to predict the author from a dataset built from excerpts from horror stories by Edgar Allan Poe, Mary Shelley, and HP Lovecraft;
- The dataset comprises almost 20.000 samples with three features: ID, Text Sample and Author. The goal is to predict the author of the sample passage;
- Word Count, Character Count, Word Density and Upper to Lower Case Words ratio are some of the features created to analyse the data and author writing patterns
- Regarding word frequency, “One” was the most used word for Mary Shelley and HP Lovecraft. For Edgard Allan Poe the most used word was “upon”;
- Logistic Regression showed better performance compared to LGBM and Naive-Bayes. An assemble of Naive-Bayes and Logistic Regression was selected as final model;
- Mary Shelley and HP samples are often misclassified as Edgar Allan Poe passages. Probably due to the larger number of samples from Edgar Allan Poe
- Additional samples (sample balancing strategies) and new features to better illustrate the different writing style between the authors should be helpful for model improvement
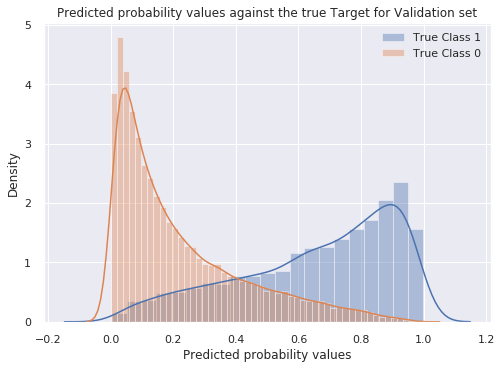
Santander Customer Transaction Challenge
- A Kaggle challenge where the goal is to predict if Santander’s clients will execute a specific transaction;
- The dataset provided by the bank is anonymised, and it is a representation of real customer data;
- It is a binary classification problem, with 200 features and 200.000 samples for each the train and test sets;
- Light GBM has shown to be an interesting choice for this dataset. The final model AUC is approximately 90% for both train and test sets;
- Preliminary tests with Logistic Regression, SVM and XGBoost have not reached AUC values above 65%. As future work, an ensemble model would be an interesting approach as well as applying ANN.
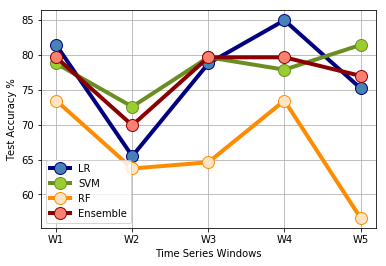
Stock Market Time-series Analysis
- This project aims to predict Facebook (FB) next day stock price direction with Machine Learning algorithms. Daily values were retrieved (volume, open, close, low and high prices) from Yahoo! Finance website. The date range is July 2012 to November 2018;
- Technical indicators and global market indexes are used, and their influence on the forecast accuracy is analysed;
- The final dataset comprises 44 features and approximately 1600 samples from daily market data;
- The results have shown that SVM outperforms logistic regression (LR), random forest (RF) and the ensemble of these algorithms for stock movement prediction. The inherent capability of SVM to avoid overfitting contributed to this conclusion;
- Essential contributions from literature allowed the construction of a model that can forecast with similar accuracies of current published papers. As it is the case for market traders, the usage of technical indicators and global indexes have shown to be a powerful strategy to support forecast decisions.
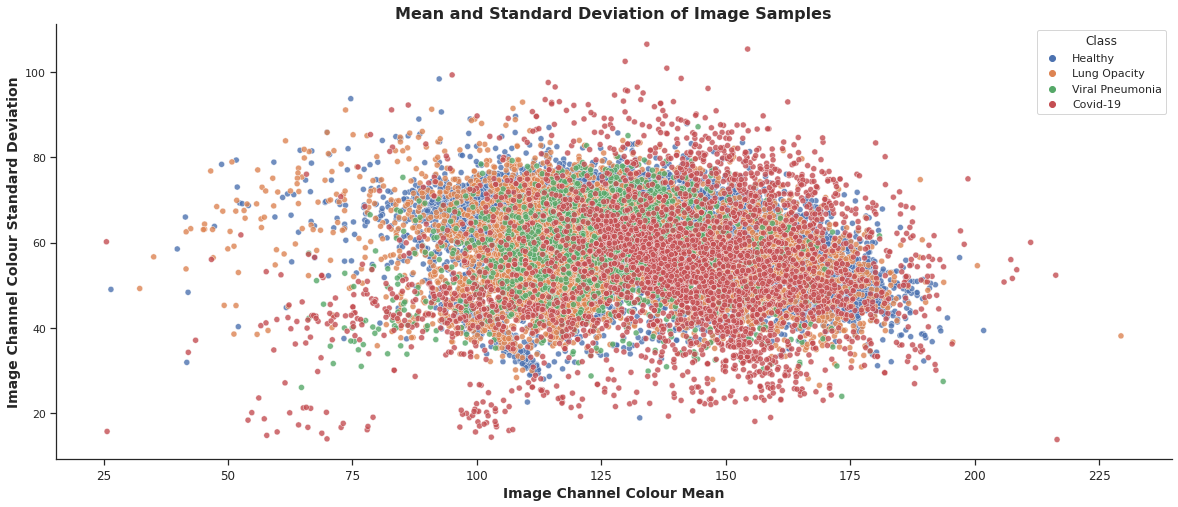
Covid-19 X-Ray Diagnosis Prediction
- This notebook uses ML to predict positive cases of Covid-19 given X-ray images. In total, there are 21165 samples divided into four main classes: Covid-19, Lung Opacity, Normal, Viral Pneumonia;
- The data is unbalanced with almost 50% of samples belongs to “Normal” class;
- Application of CNN to predict the sample diagnosis. The model converges after 60 epochs
- Model results:
- Covid-19, when misclassified, can be predicted as Lung Opacity or Normal samples. Not likely to be classified as Viral Pneumonia
- Normal samples are usually misclassified as Viral Pneumonia or Lung Opacity. Less common to be mistaken for Covid-19
- All metrics used presented an overall results above 75%. Results per class have varied, with Covid samples presenting higher Precision ~80% than Recall ~61%
- Accuracy Result: 79.37% / Precision Result: 76.08% / Recall Result: 79.14% / F-Score Result: 76.68%
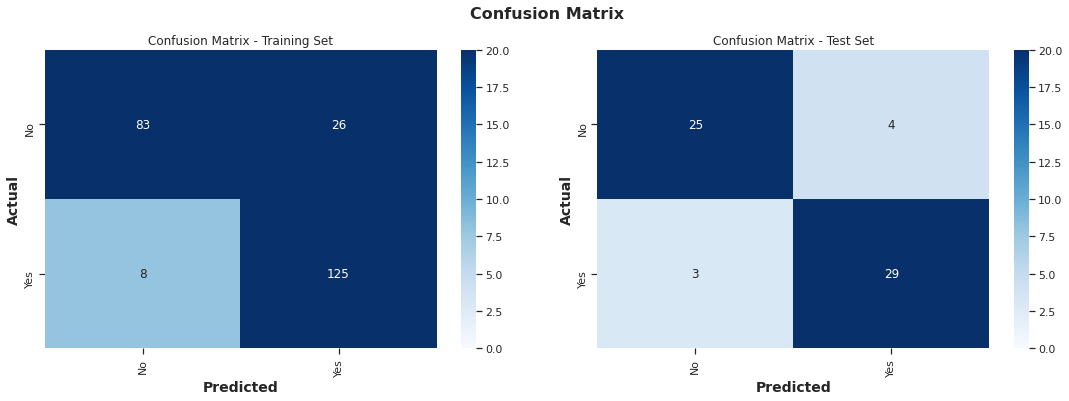
UCI Heart Attack Dataset
- Binary Classification problem using a amall dataset with approximately three hundred samples and fourteen features
- Overall, the dataset is balanced between both classes of the Target feature. However, there is an expressive unbalance regarding gender, where Males compose ~70% of the data
- A higher concentration of positive Heart Attack samples appears in the region where lower values for Age and Cholesterol and higher values of Heart rate meet
- Data Scaling, OneHotEncoding and the use of KMean for the creation of new features did not improve model generalisation
- In the training set results, the model shows a tendency for False Positives
- Optuna Optimisation library is used to choose the best model between: Random Forest and Logistic Regression. Preliminary tests excluded SVM and KNN as options
- Best Model is Logistic Regression with 89,7% Accuracy. The models were finely tuned with Optuna Library
Exploratory Data Analysis (EDA’s)
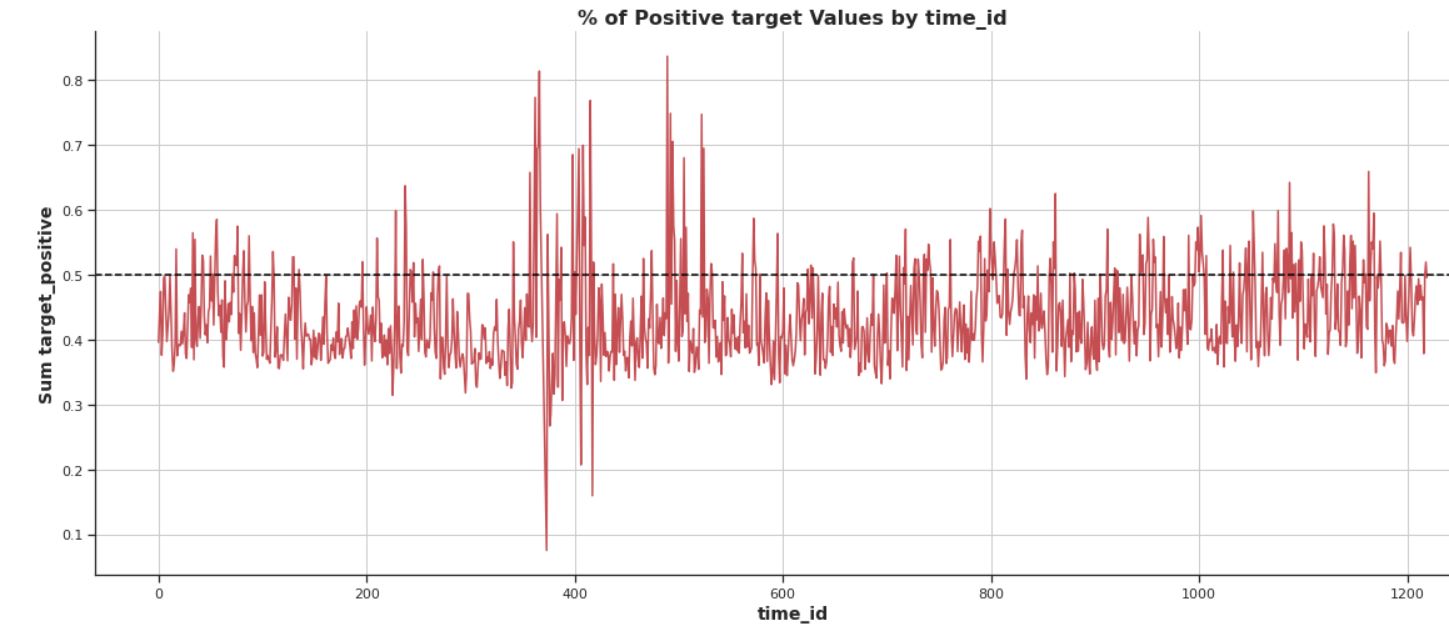
Ubiquant Market Prediction Challenge 2022
- Ubiquant Investment (Beijing) Co., Ltd is a leading domestic quantitative hedge fund based in China. In this Kaggle competition, the goal is to build a time-series model that forecasts the return rate of the dataset provided by Ubiquant
- The dataset contains over 3 million rows and 300 anonymized features. All features present numeric values
- Key Insights include:
- The data contains over 3.500 unique investment ID’s, covering a period of 1200 time ID’s
- The number of active unique investments ID’s varies over time, e.g. some investment have less than 100 entries while other are present in every time ID
- The Target variable varies from -9 to +12, with a mean of -0.021. There is a higher ratio of negative target values. However, after time ID 800 this ratio difference is reduced
- Certain data periods present interesting behaviors that can affect the model. For example, in the period around time ID 400 there is a high fluctuation of positive and negative target outcomes (see graph)
- From the analysis is possible to see that Data Transformation, Feature Importance analysis and smart handling of time series windows for training and validation are strategies that might pay off for this challenge
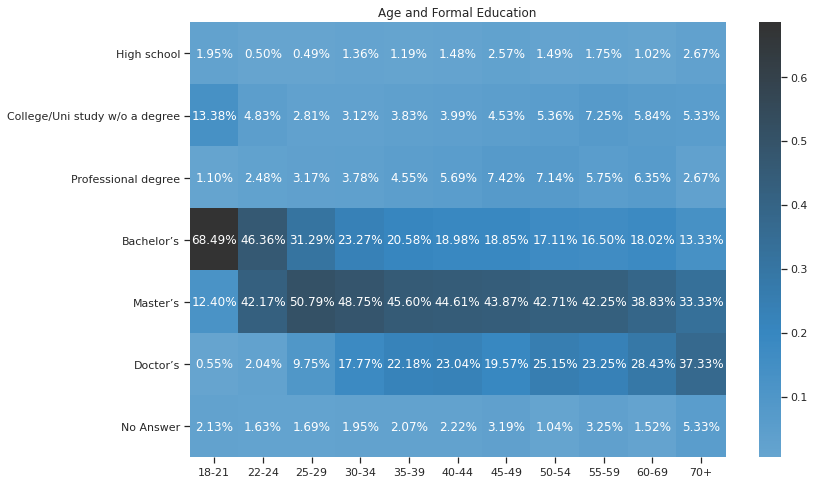
Kaggle EDA Challenge 2020
- Exploratory data analysis (EDA) of the most comprehensive dataset available on the state of machine learning and data science today according to the Kaggle Community
- The survey answers covered demographic, education, employment, and technology usage to learn more about data science practitioners in 2020.
- Key Insights include:
- India, the USA and Brazil are the countries with the most survey participants
- India is the country with the highest number of young participants (18-21 years old)
- Female participation range from 15-20% across different countries
- 39% of participants hold a Masters and 34% Bachelors degrees, demonstrating the importance of Formal Education
- Almost 60% of doctorates are working as Research Scientists. Also, PhD holders account for only 7% of currently unemployed. Unfortunately, 42% of currently unemployed hold a Bachelor degree
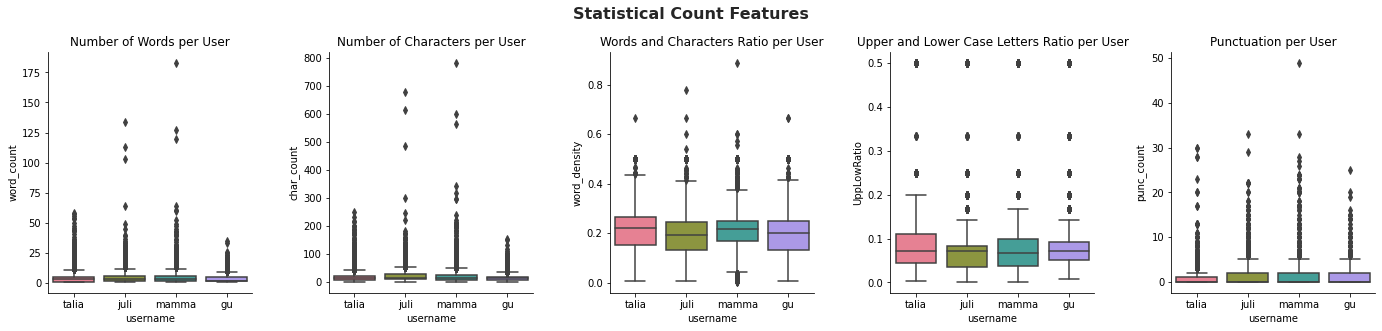
Analysing Text Data - Whatsapp Messages
- The notebook is an analysis of my family Whatsapp group. The data contains 40.000 texts, from April-2016 to September-2020
- To simulate a realistic scnario, the text data is processed and sent to a SQL database (sqlite3). The pre-processing and retrival of data is performed using Python
- The majority of messages are short, with one or two words and the time where most messages are exchanged is the Evening
- The data contained a few outliers, such as messages upto 175 words or 800 characters
- The analysis also showed that the conversation is less active from months of April to August. In contrast, February has shown to be a communicative month for us
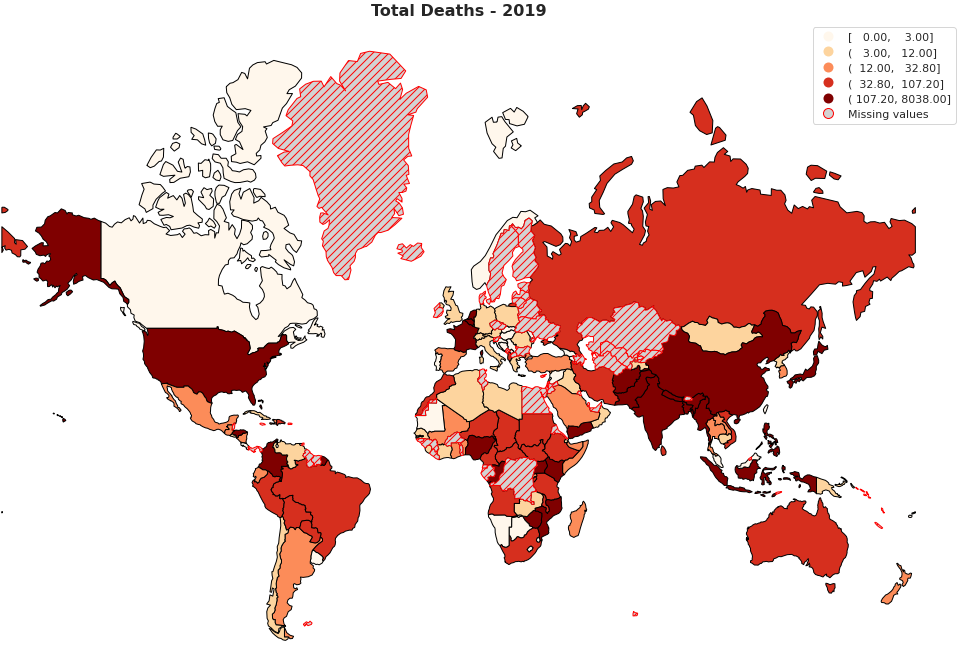
Natural Disasters 1900-2021: An EDA
- This notebook explores EM-DAT data extracted from www.emdat.be. The data being analysed takes into account all continents, and presents details regarding natural disasters from 1900 to currrent date
- The database is compiled from various sources, including UN agencies, non-governmental organisations, insurance companies, research institutes and press agencies
- Key Insights:
- The number of Natural Disasters recorded has increased over the years. While the EM-DAT has started collecting data officially from 1988, we see a proeminent upward trend starting in the 60’s and seems to reach a peak in the 00’s, and continue to vary around this peak to this day
- In total, the number of disasters seem to have stabilised, however, there seems to be a trend that every two or three years there is a sharp rise
- Metereological (e.g. Storms) and Hydrological (e.g. Floods) are the most commonly occurring types of disasters, followed by Geophysical (e.g. Volcanic Activity), Biological (e.g. Epidemic) and Climatological (e.g. Drought)
- Climatological events have taken more lives than any other type of Natural Disasters, followed by Hydrological events
- Hydrological events are the ones who affect most people
- Floods (Hydro), Storms (Meteo) and Earthquakes (Geo) are the Disasters Subtypes that occurred the most since 1900. In total, 5.400 Floods, 4.400 Storms and 1.500 have been recorded since then.
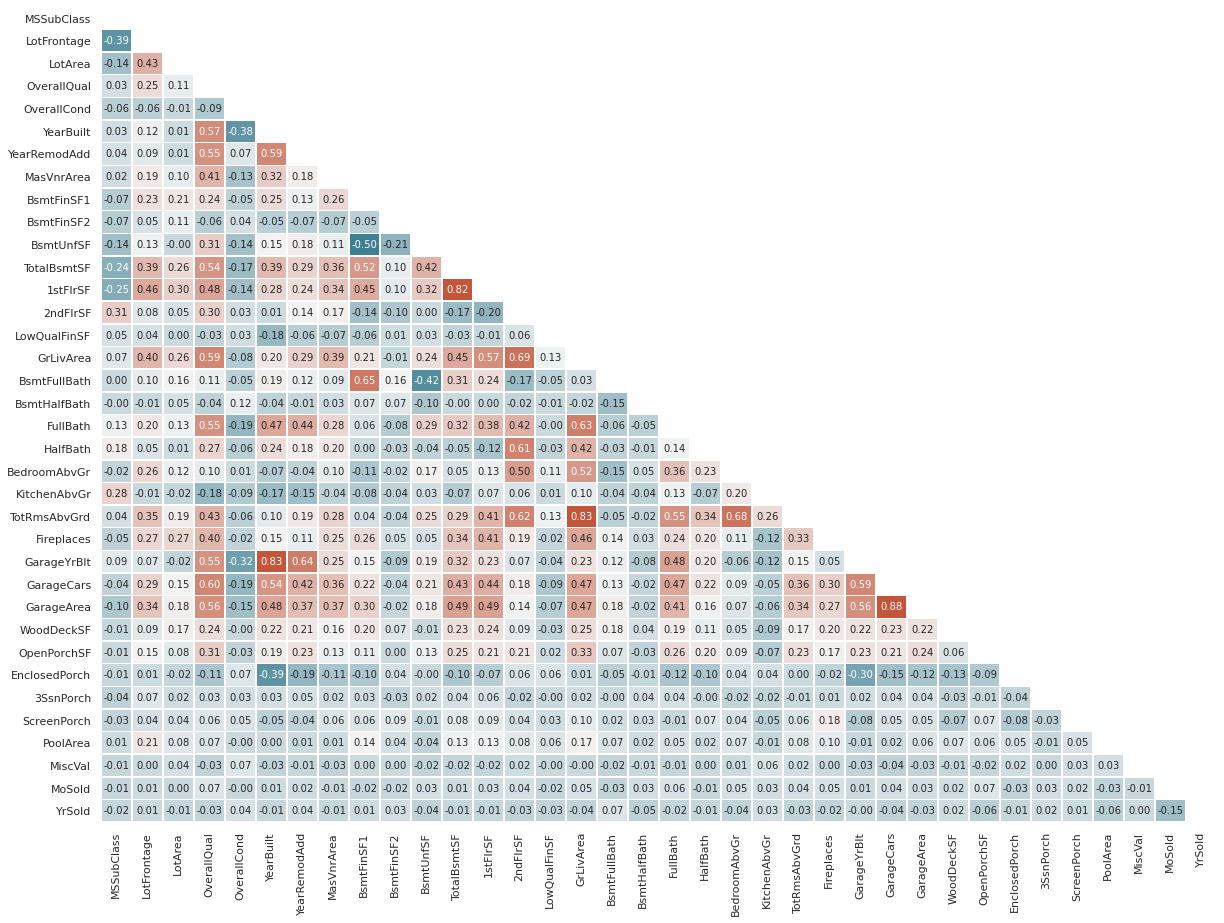
Iowa House Market
- The dataset contains 79 explanatory variables describing (almost) every aspect of residential homes in Ames, Iowa
- In here an initial data analysis is performed to guide the next steps. The most relevant points learned from this data analysis are:
- A strategy to handle the null values must be trialled. KNN, mean values replacement and MICE strategies need to be tested
- There are features that are highly correlated. They could be removed or combined to simplify the dataset
- Skewed variables are present. Feature transformation can be used to improve model performance, mainly if ANN or SVM are used
- From the feature analysis, it was possible to obtain ideas for new features that could improve model performance.